In a paper titled "Correlation-Assisted Pixel Array for Direct Time of Flight", A. Morsy and M. Kuijk or Vrije Universiteit write:
Abstract
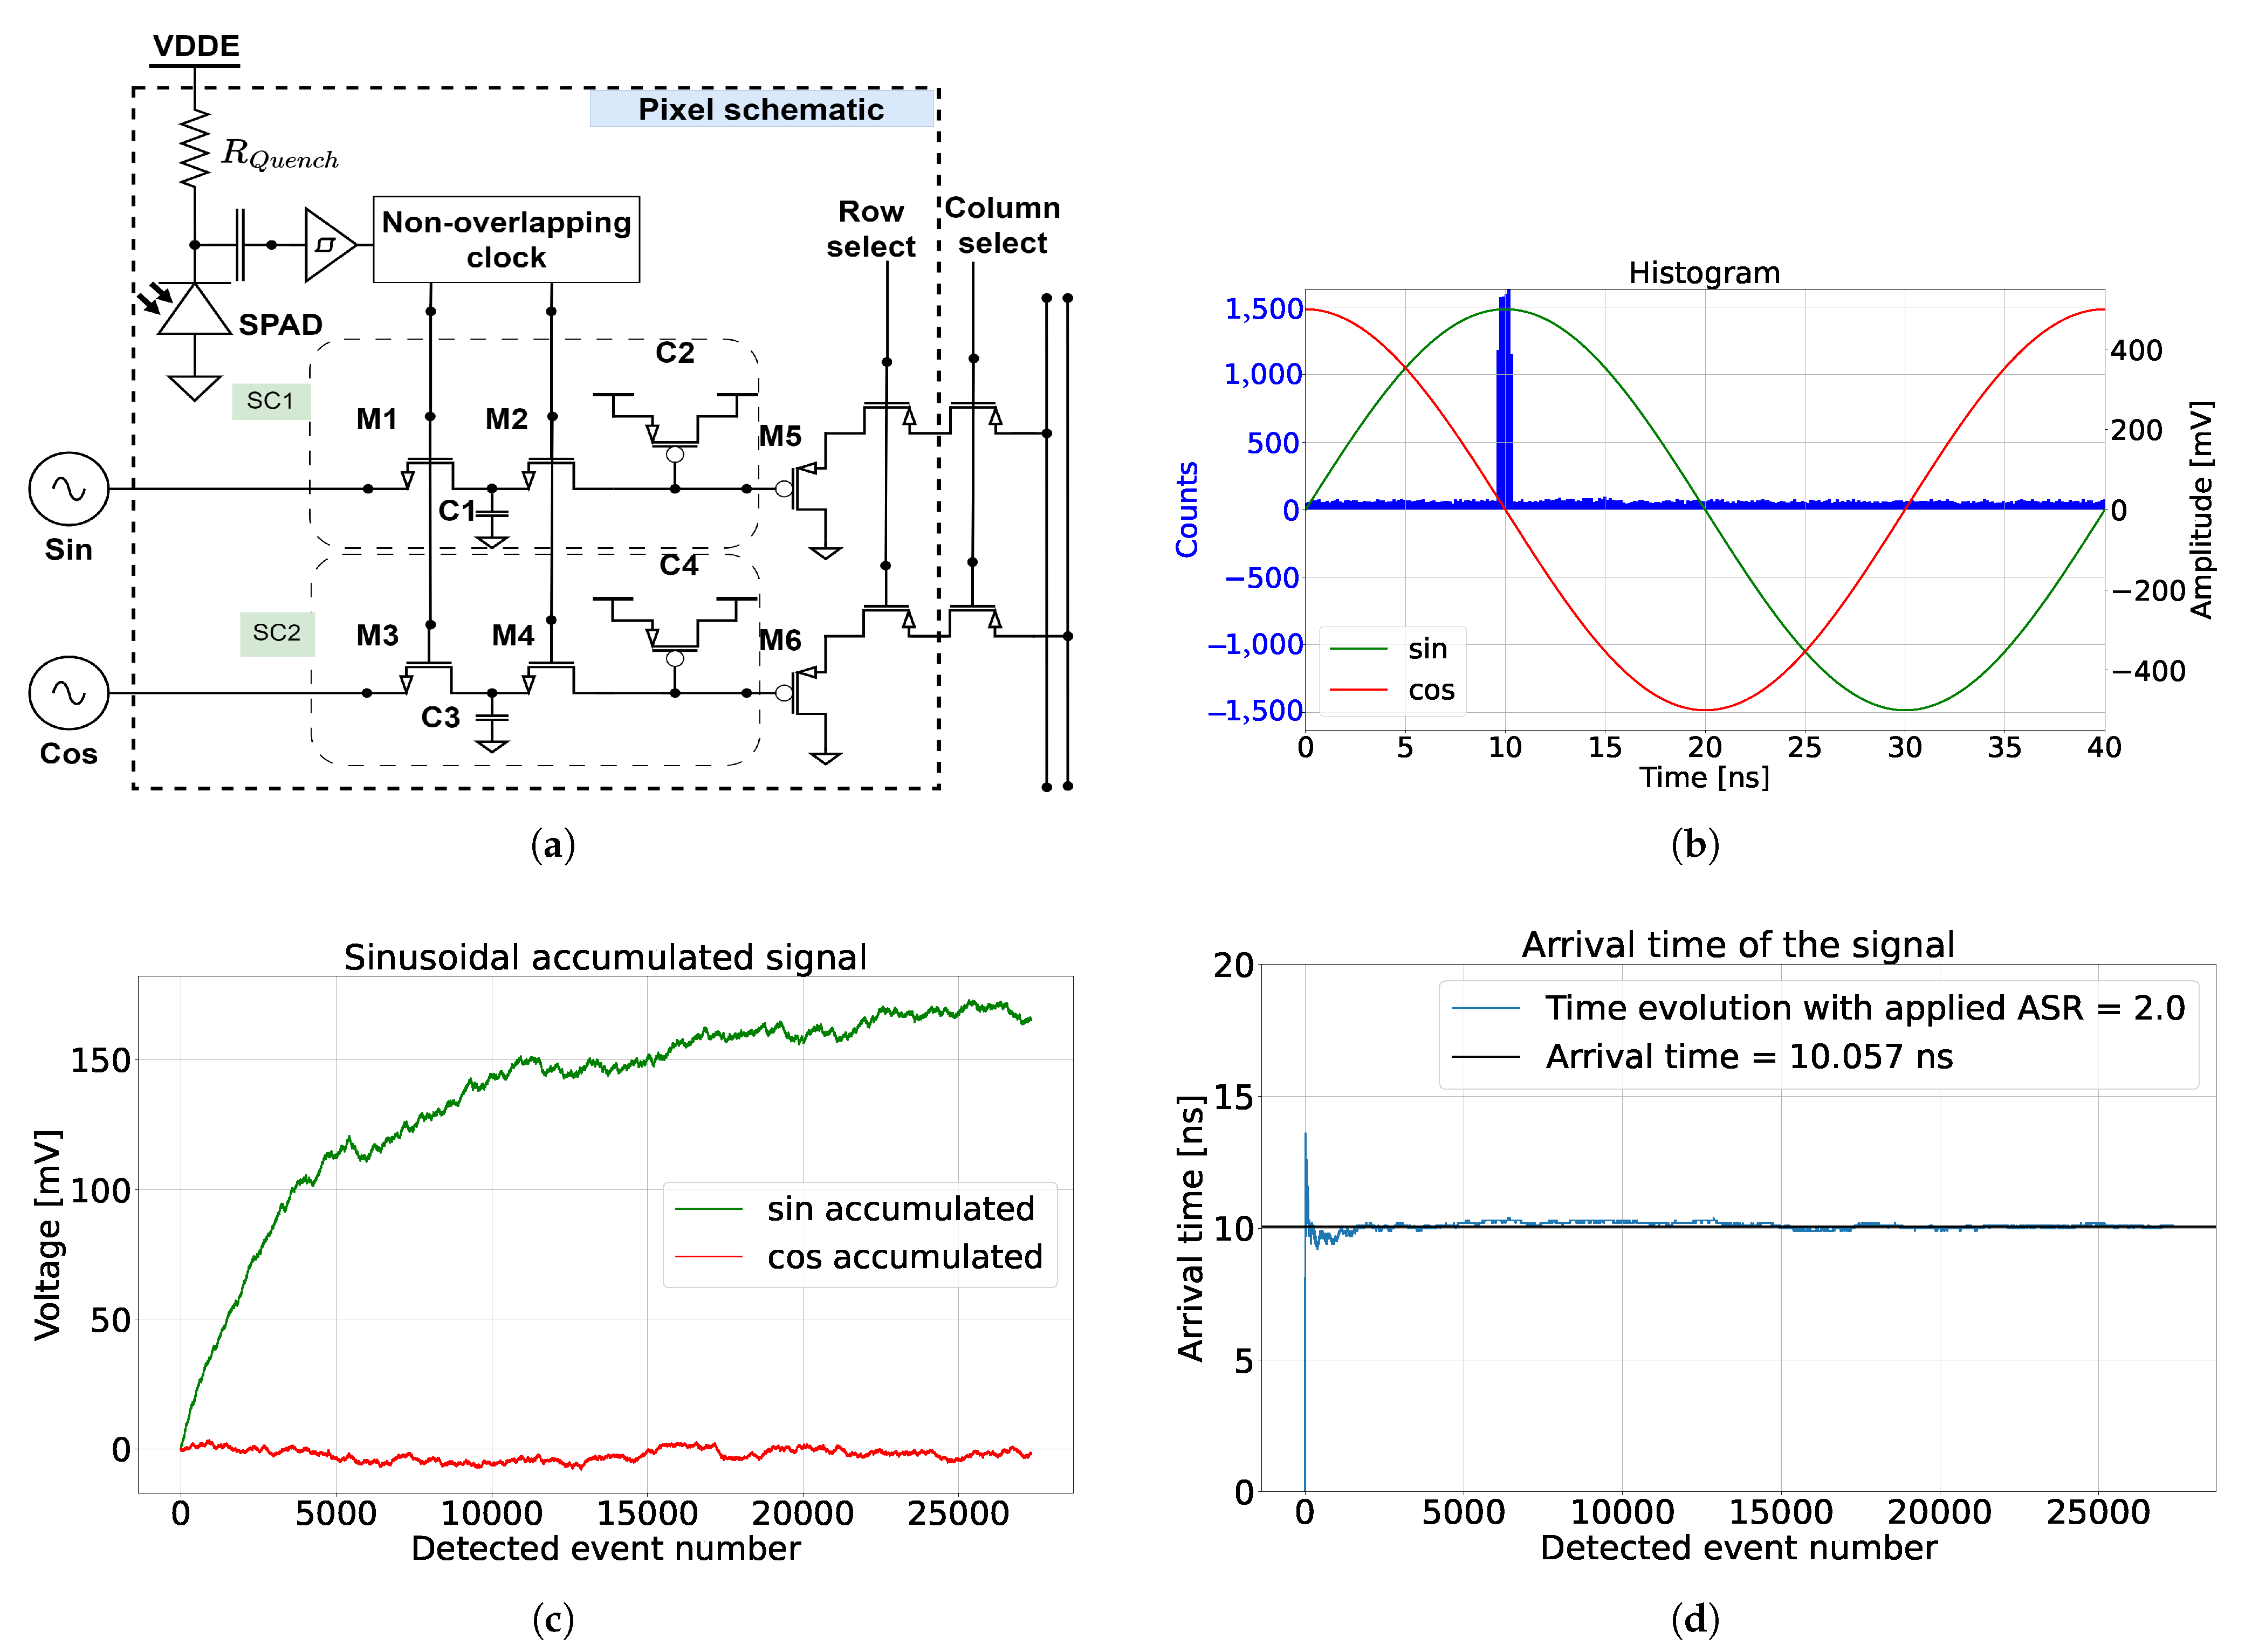
Time of flight is promising technology in machine vision and sensing, with an emerging need for low power consumption, a high image resolution, and reliable operation in high ambient light conditions. Therefore, we propose a novel direct time-of-flight pixel using the single-photon avalanche diode (SPAD) sensor, with an in-pixel averaging method to suppress ambient light and detect the laser pulse arrival time. The system utilizes two orthogonal sinusoidal signals applied to the pixel as inputs, which are synchronized with a pulsed laser source. The detected signal phase indicates the arrival time. To evaluate the proposed system’s potential, we developed analytical and statistical models for assessing the phase error and precision of the arrival time under varying ambient light levels. The pixel simulation showed that the phase precision is less than 1% of the detection range when the ambient-to-signal ratio is 120. A proof-of-concept pixel array prototype was fabricated and characterized to validate the system’s performance. The pixel consumed, on average, 40 μW of power in operation with ambient light. The results demonstrate that the system can operate effectively under varying ambient light conditions and its potential for customization based on specific application requirements. This paper concludes by discussing the system’s performance relative to the existing direct time-of-flight technologies, identifying their strengths and limitations.
Figure 2. (a) Histogram of accumulated ambient light over a period {T} for a certain integration time. (b) Histogram of ambient light and laser pulses with an FWHM {a} detected with an arrival time {l} over a period {T}, along with ambient light that is uniformly distributed over the integration time.
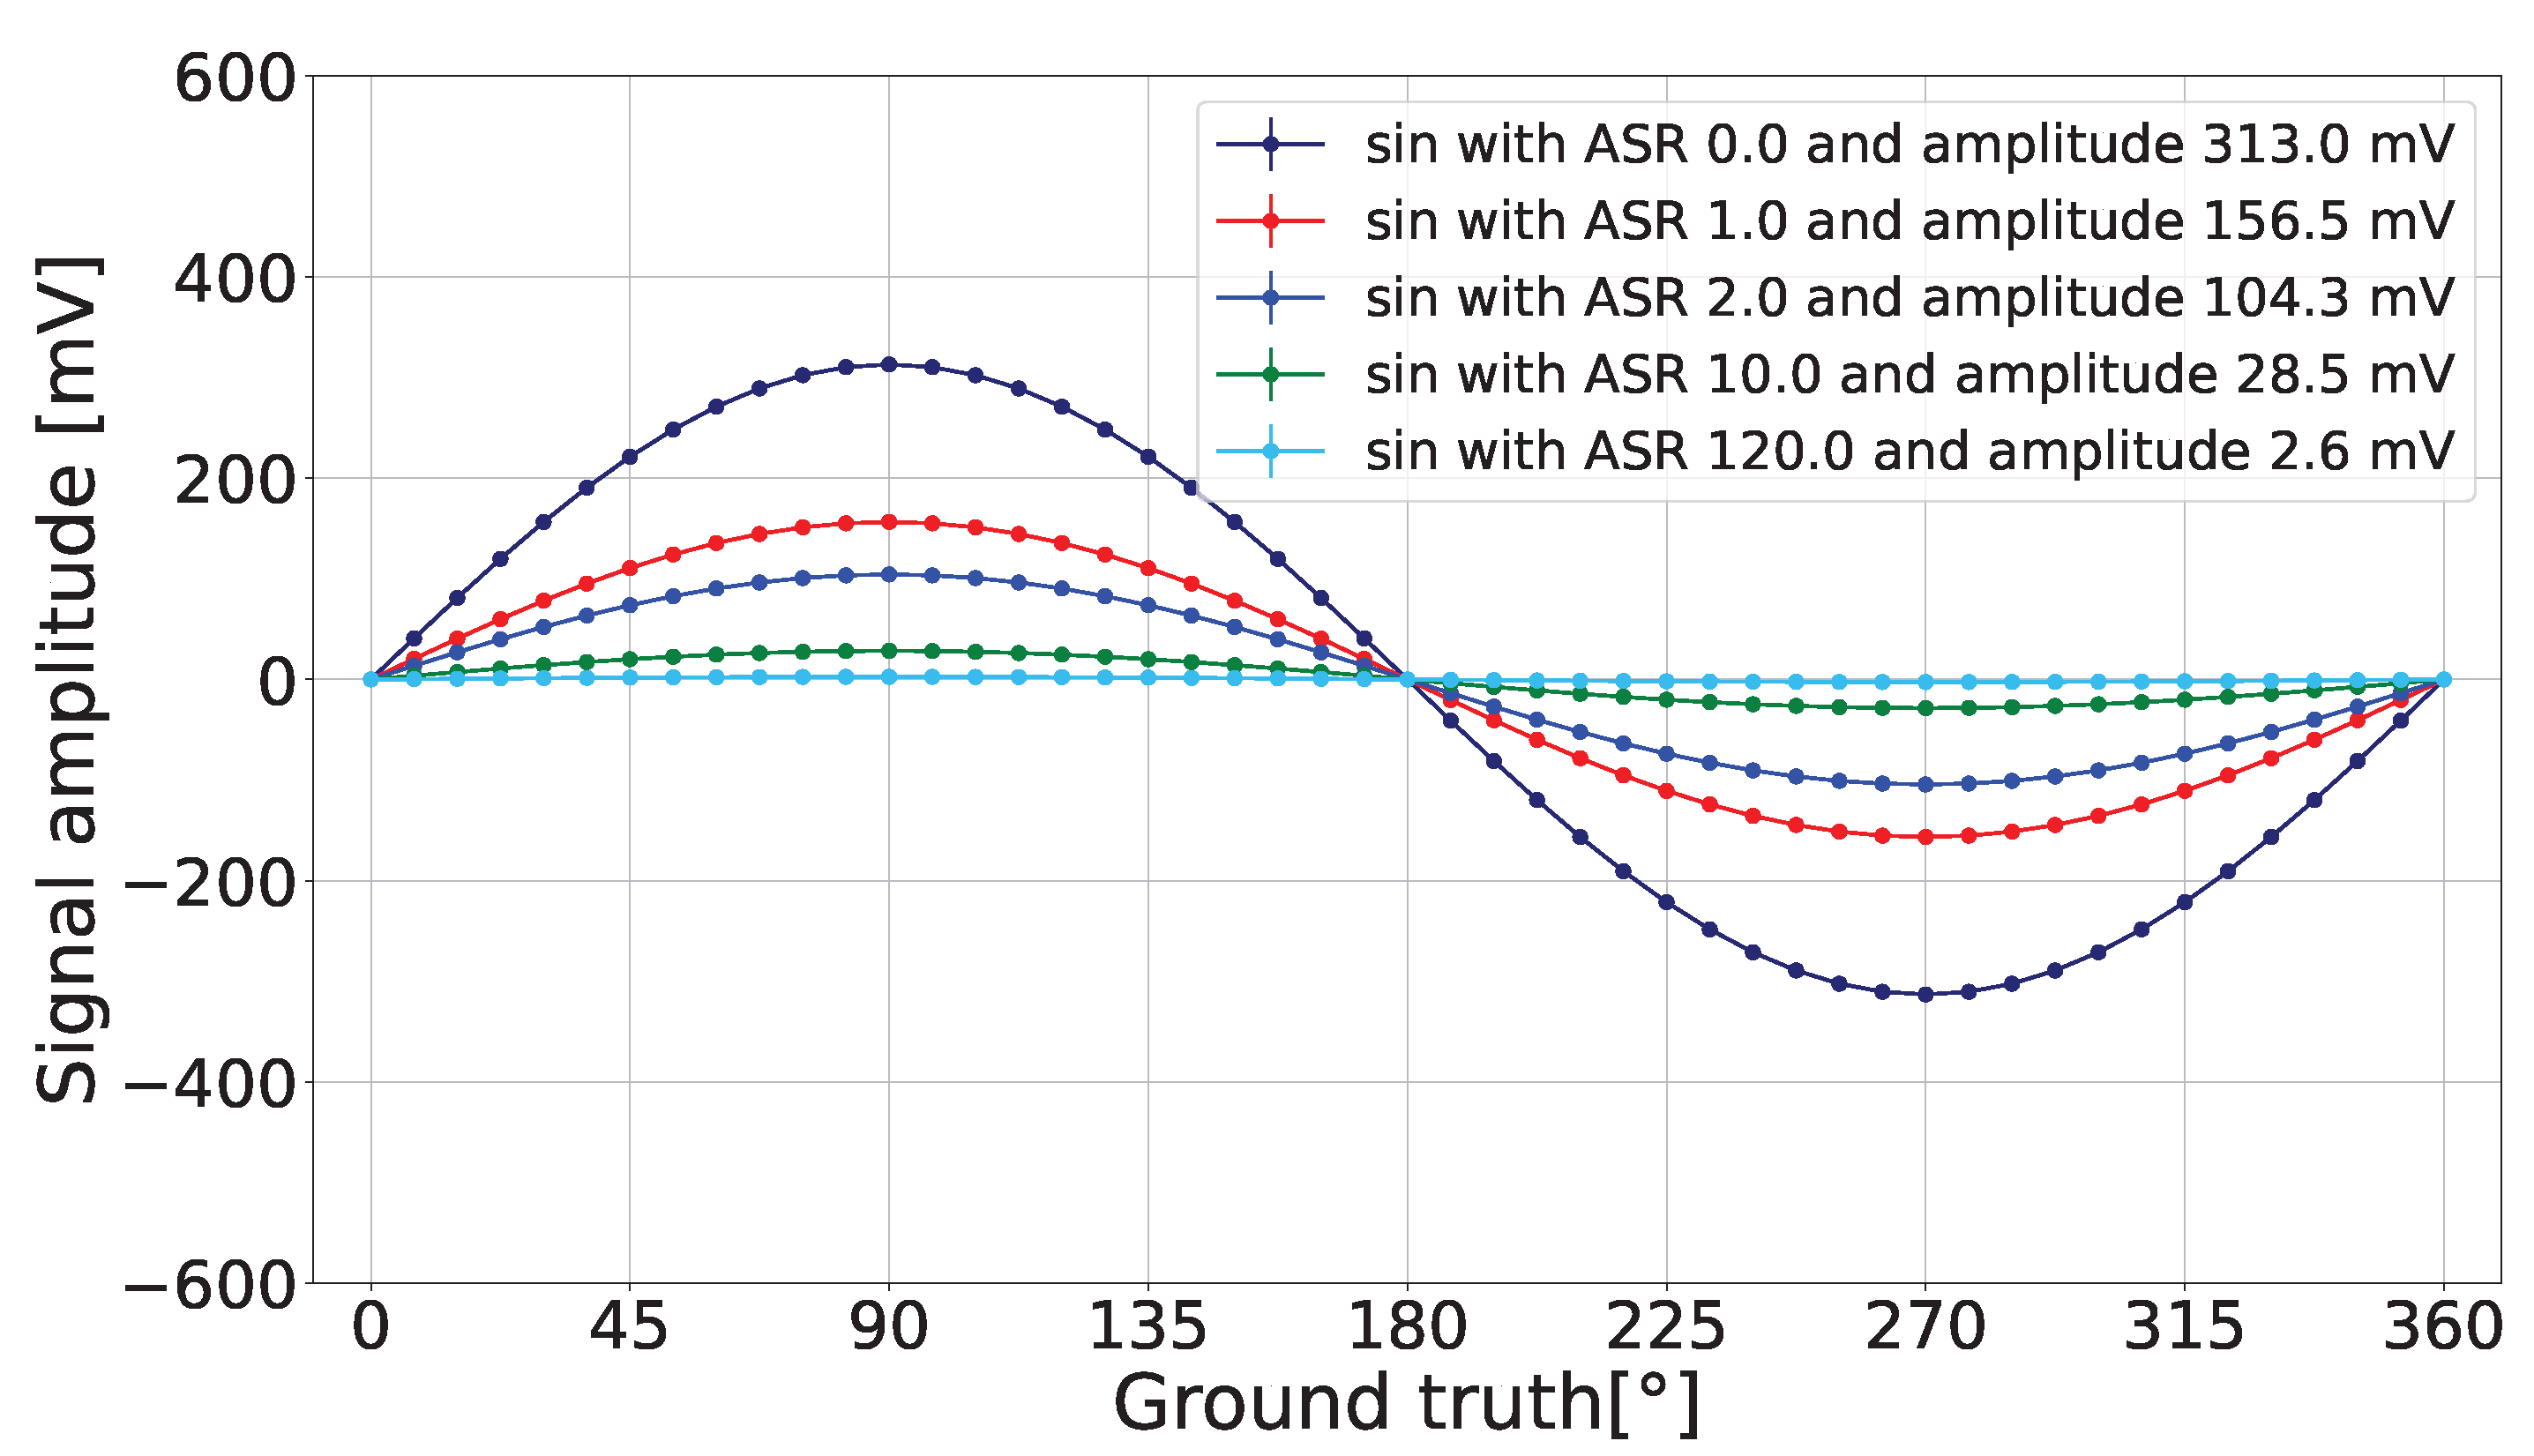
Figure 3. Reduction in the detected sine’s amplitude for different ASR values when a=4.25%·T and C=274.6 mV.
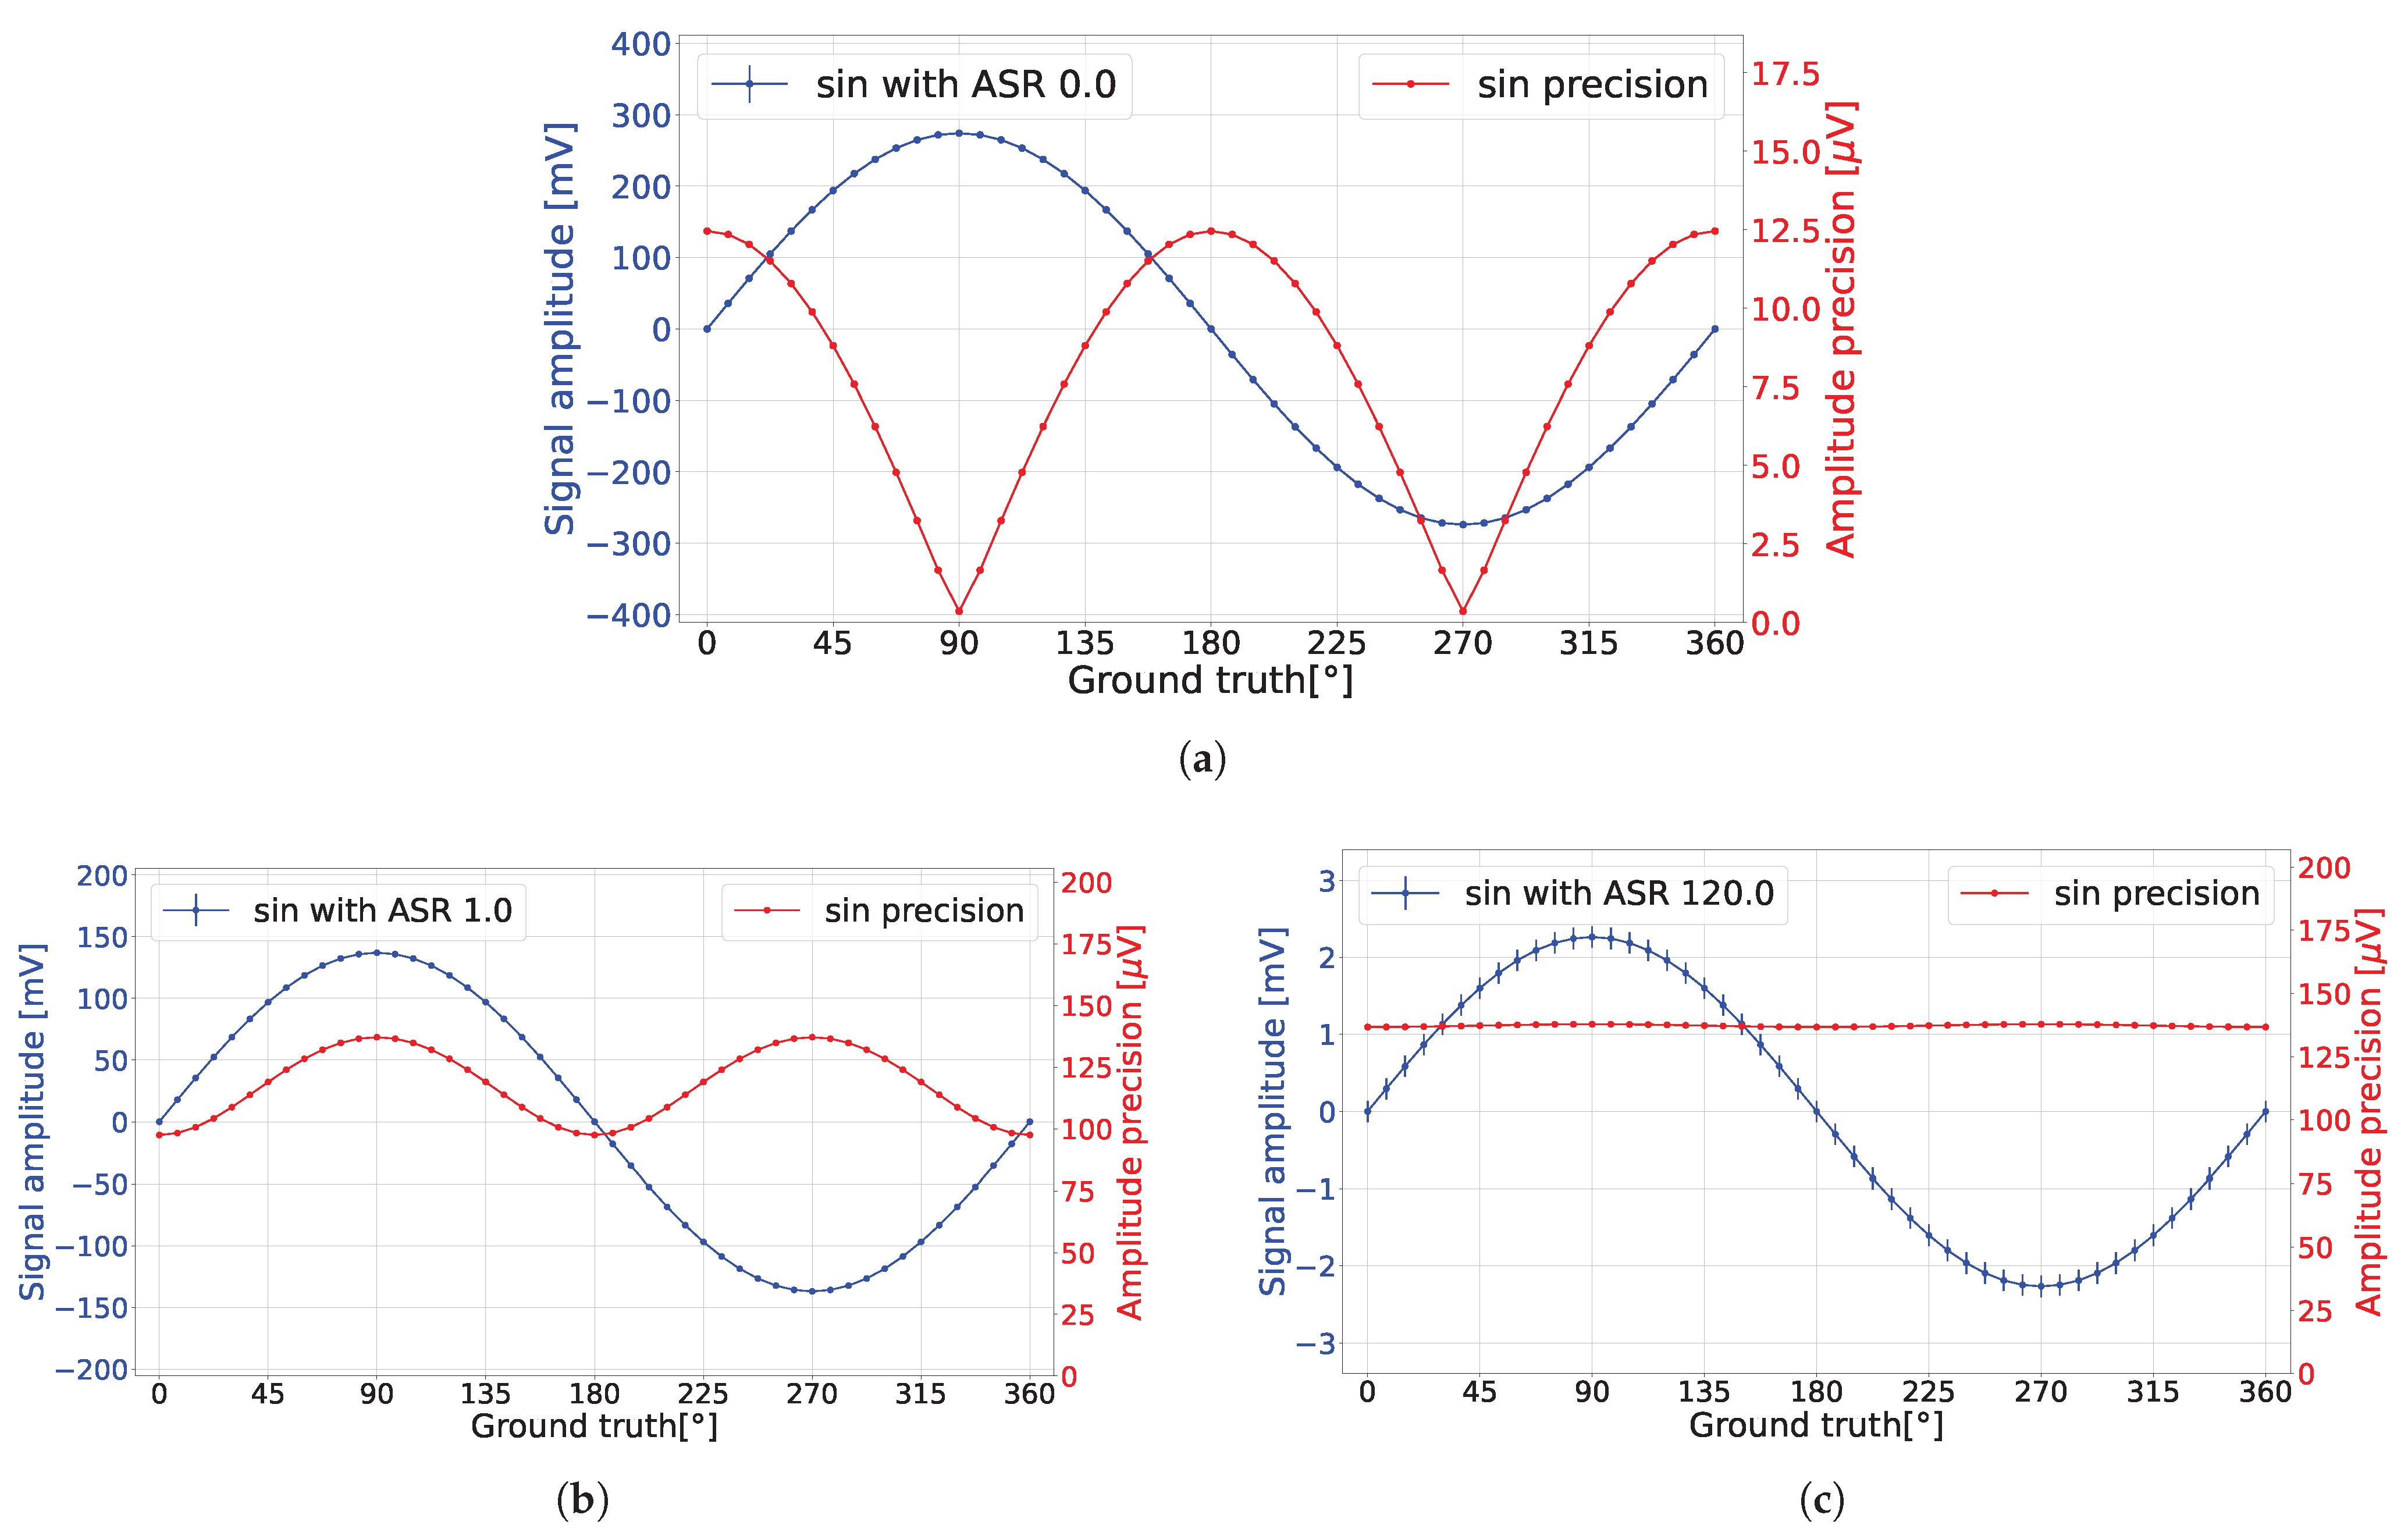
Figure 4. (a) When ASR = 0, the analytical model predicted that the detected voltage precision was oscillating due to active light shot noise. (b) When ASR = 1, the analytical model predicted that the detected voltage precision was oscillating due to the influence of laser and ambient light shot noise. (c) When ASR = 120, the analytical model predicted that the detected voltage precision oscillation was not significant due to the dominant ambient light shot noise.
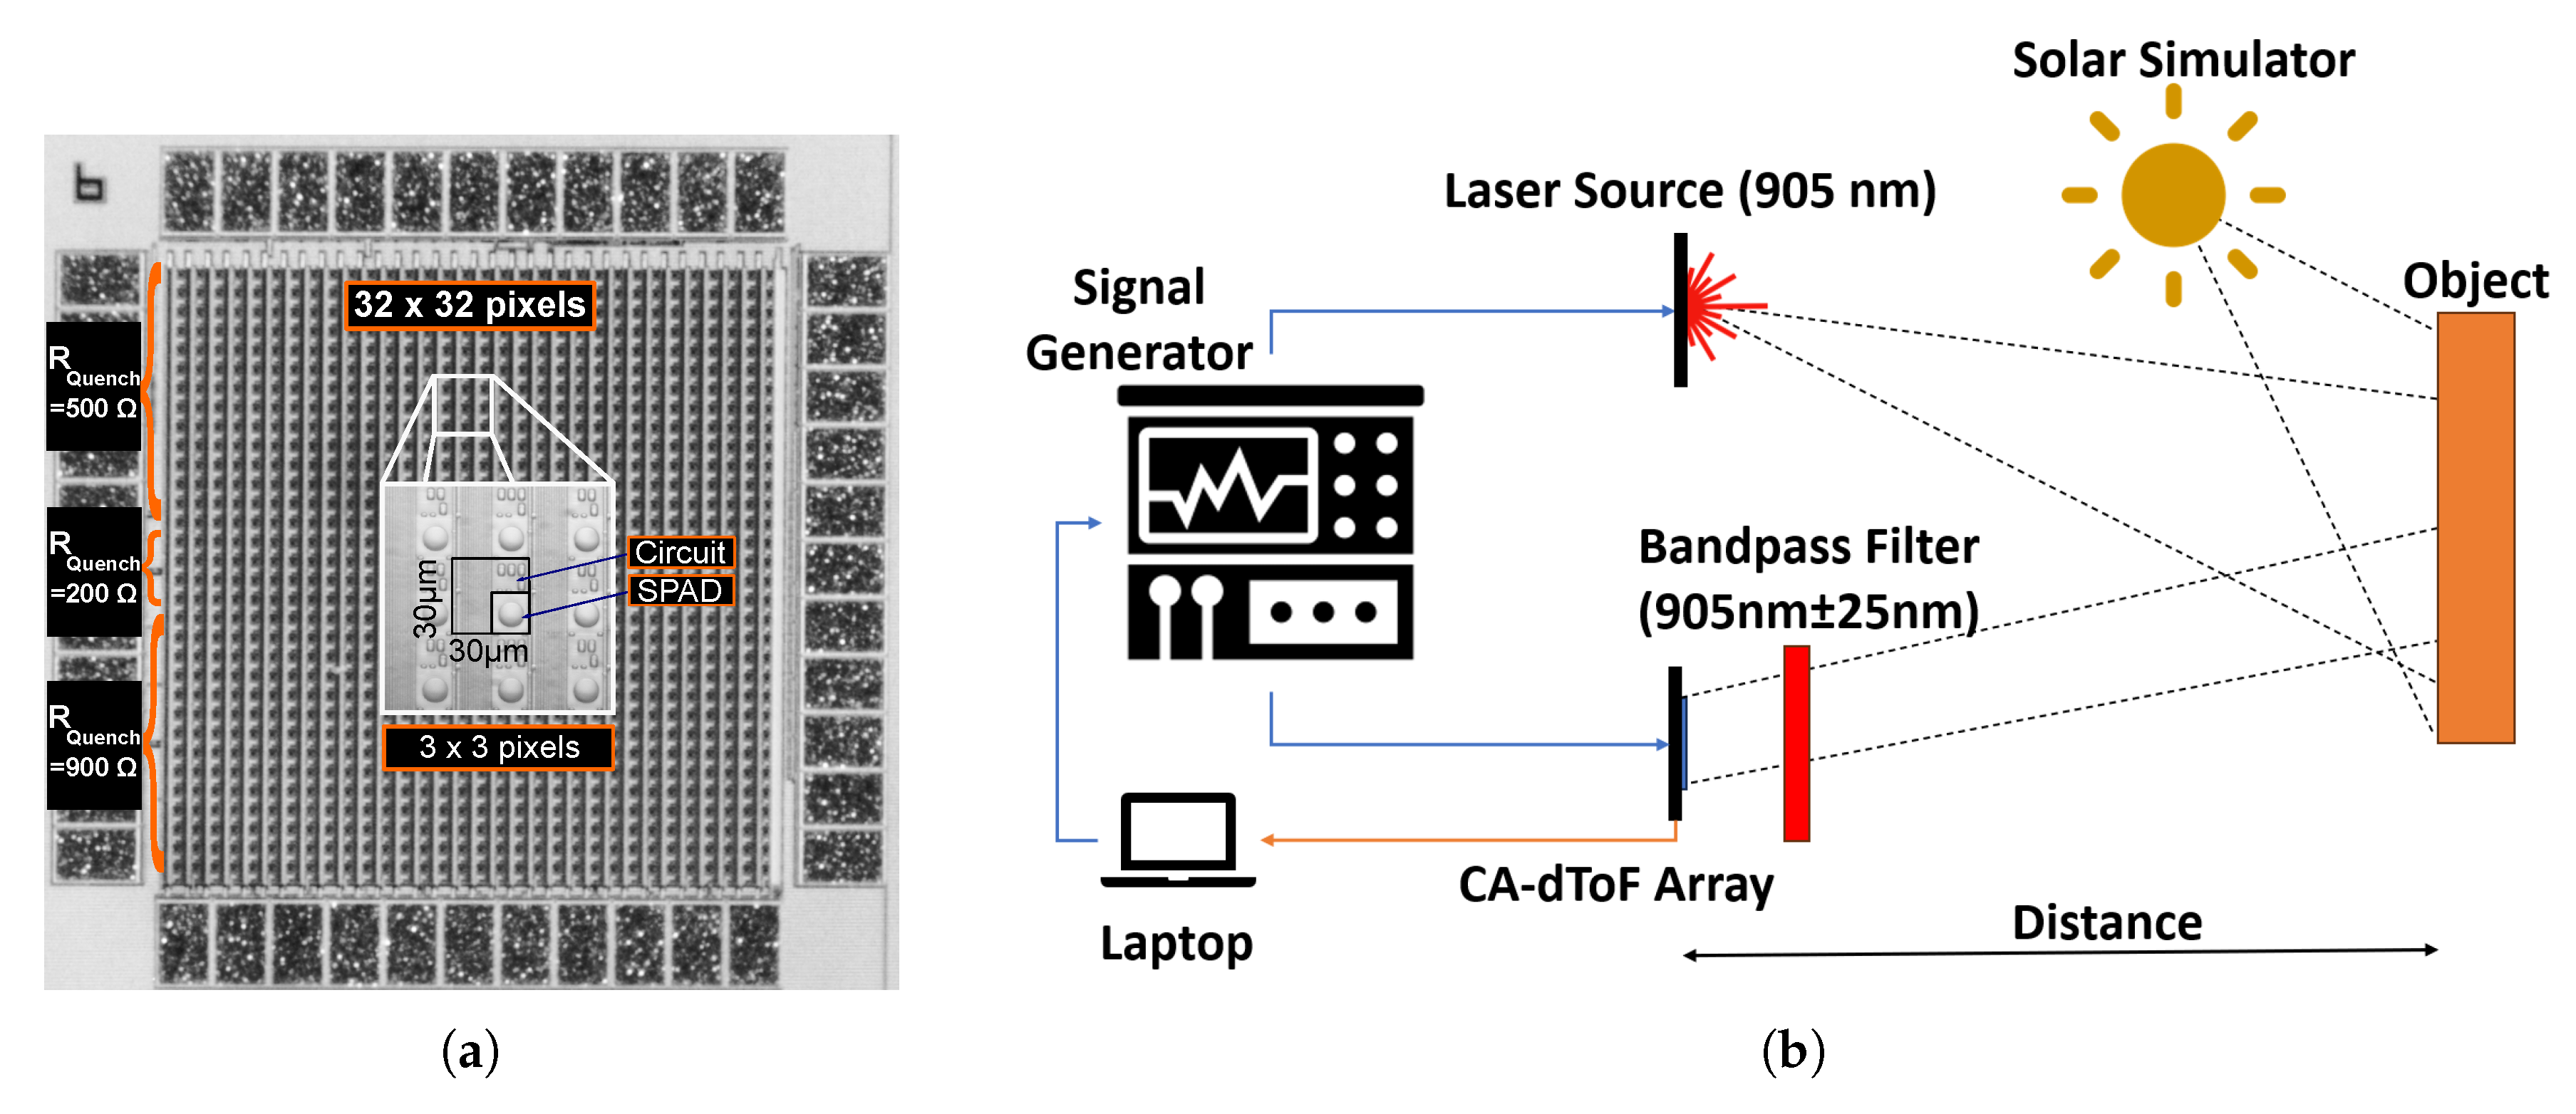
Figure 12. (a) CA-dToF pixel array micrograph with three different quenching resistors. (b) The experimental set-up.
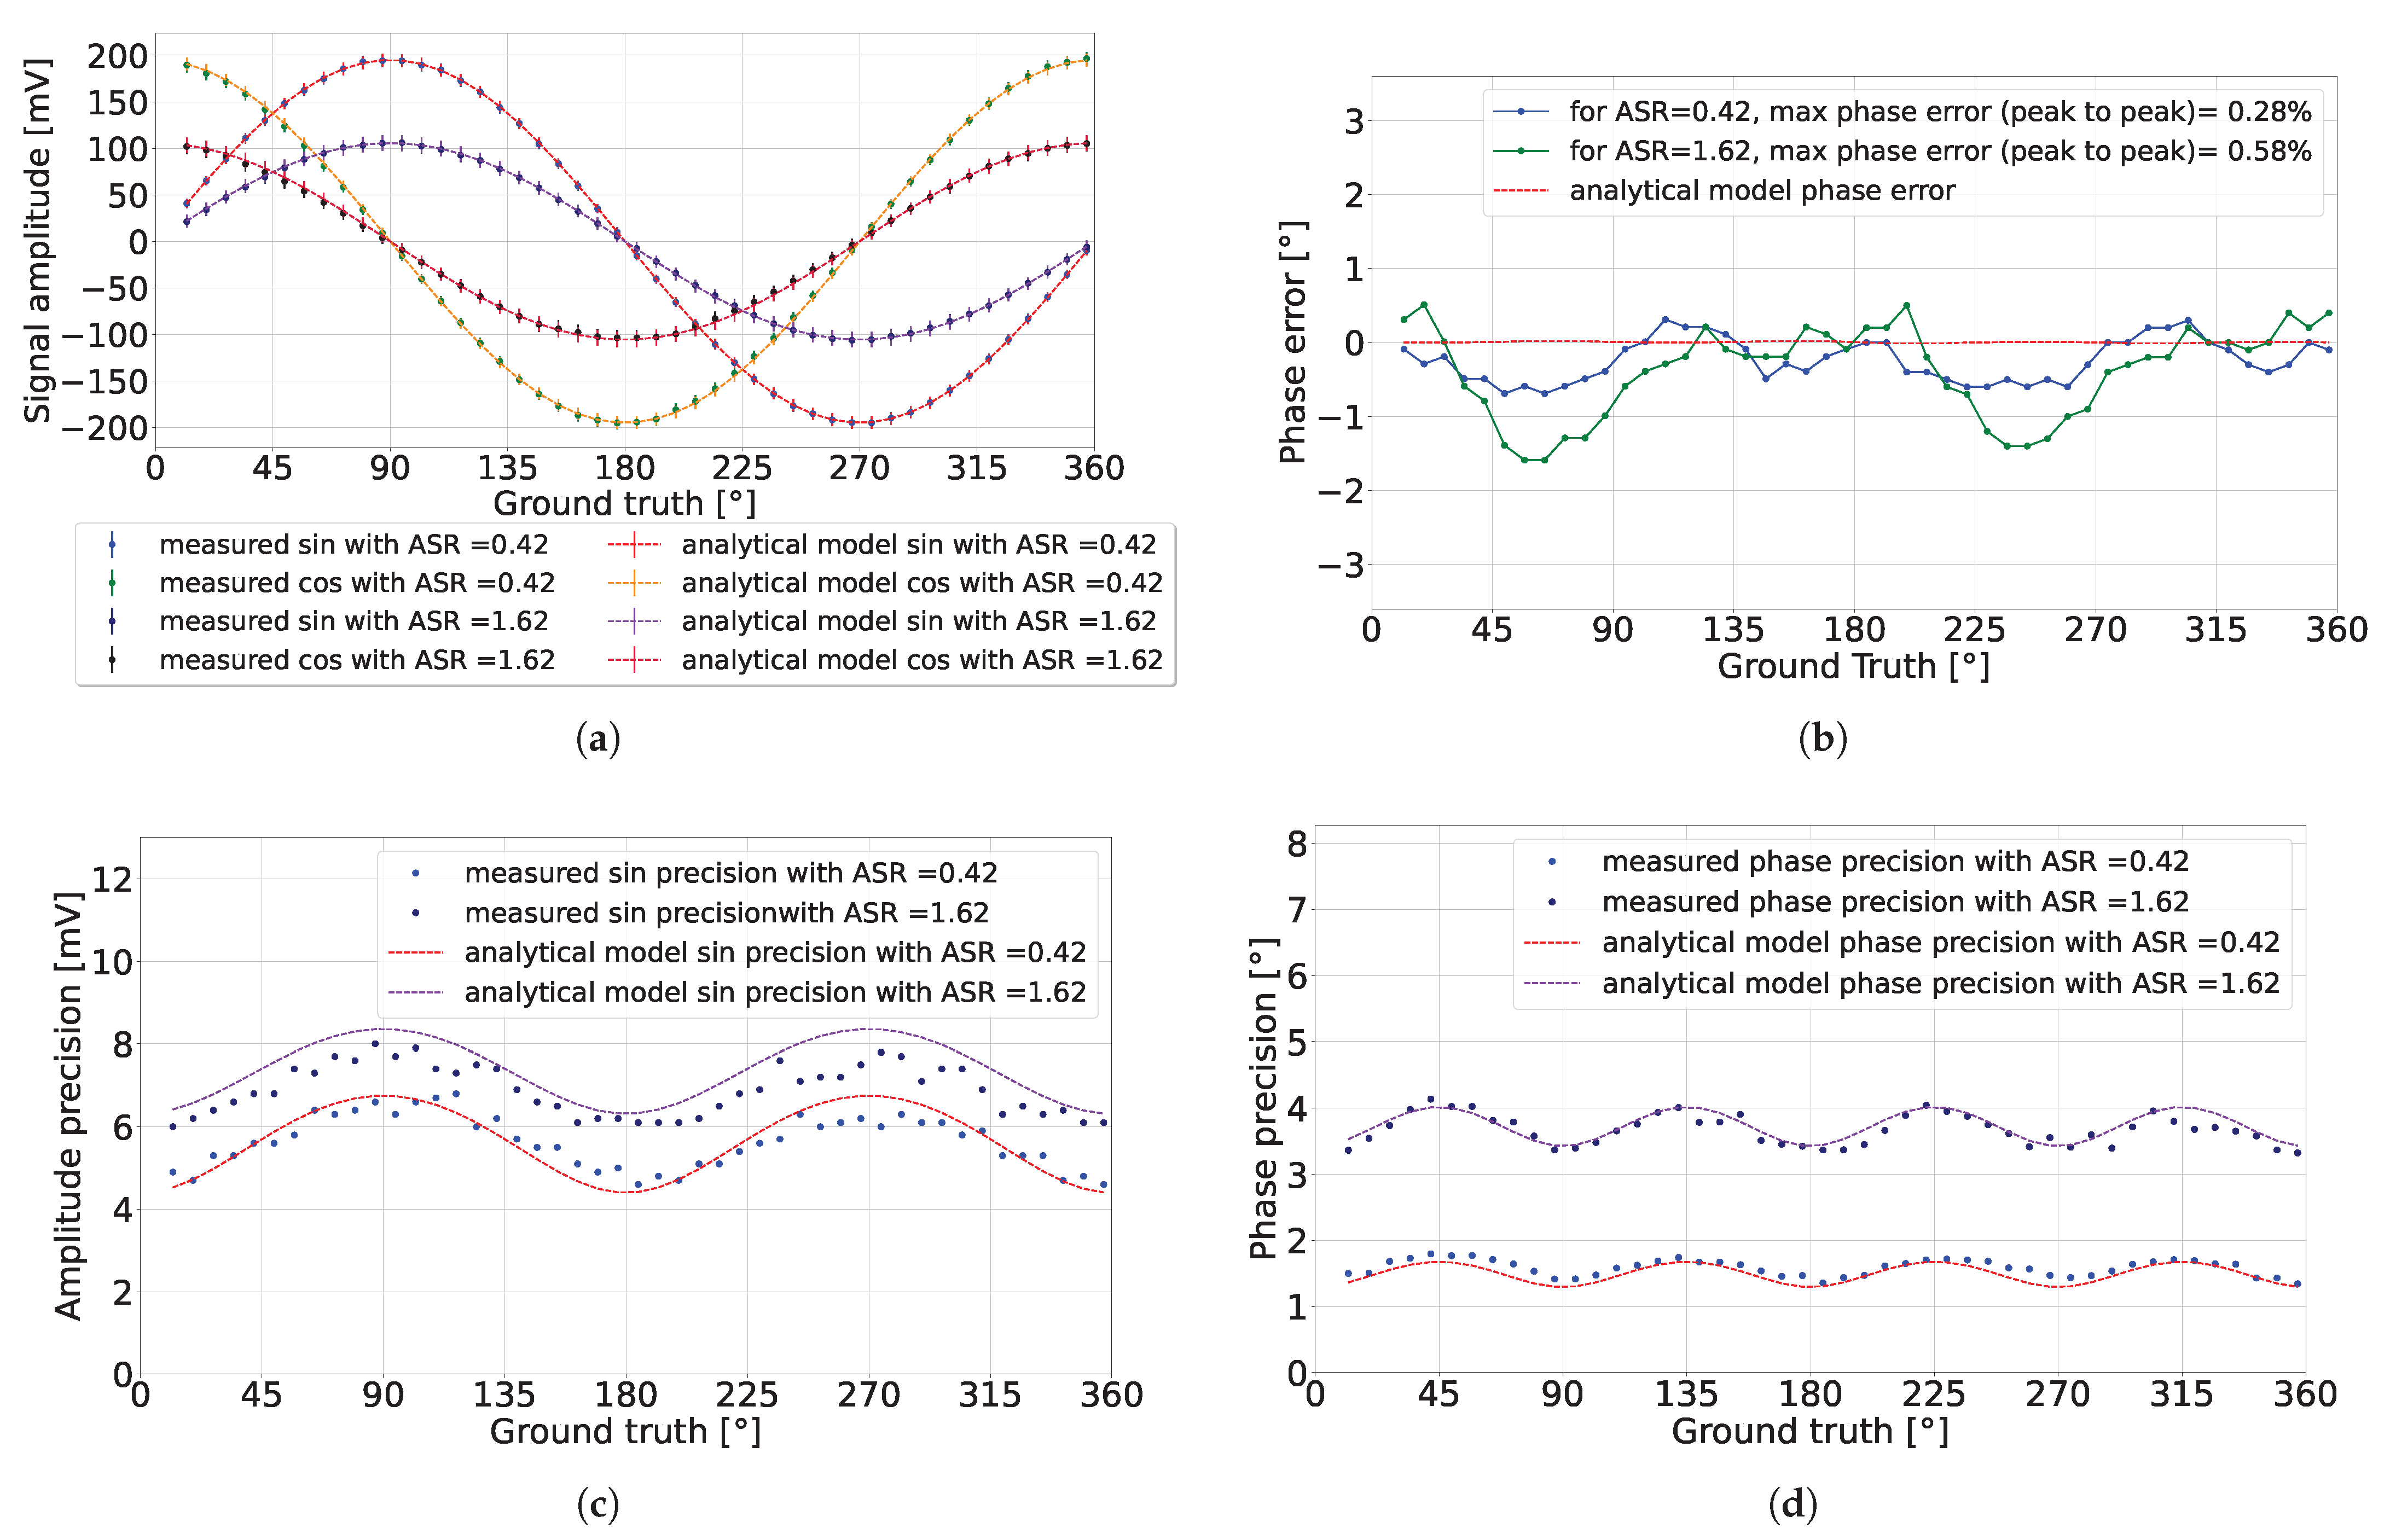
Figure 13. CA-dToF pixel experimental results for two different ASR values: (a) detected signal, (b) detected phase error, (c) detected amplitude precision, and (d) detected phase precision.
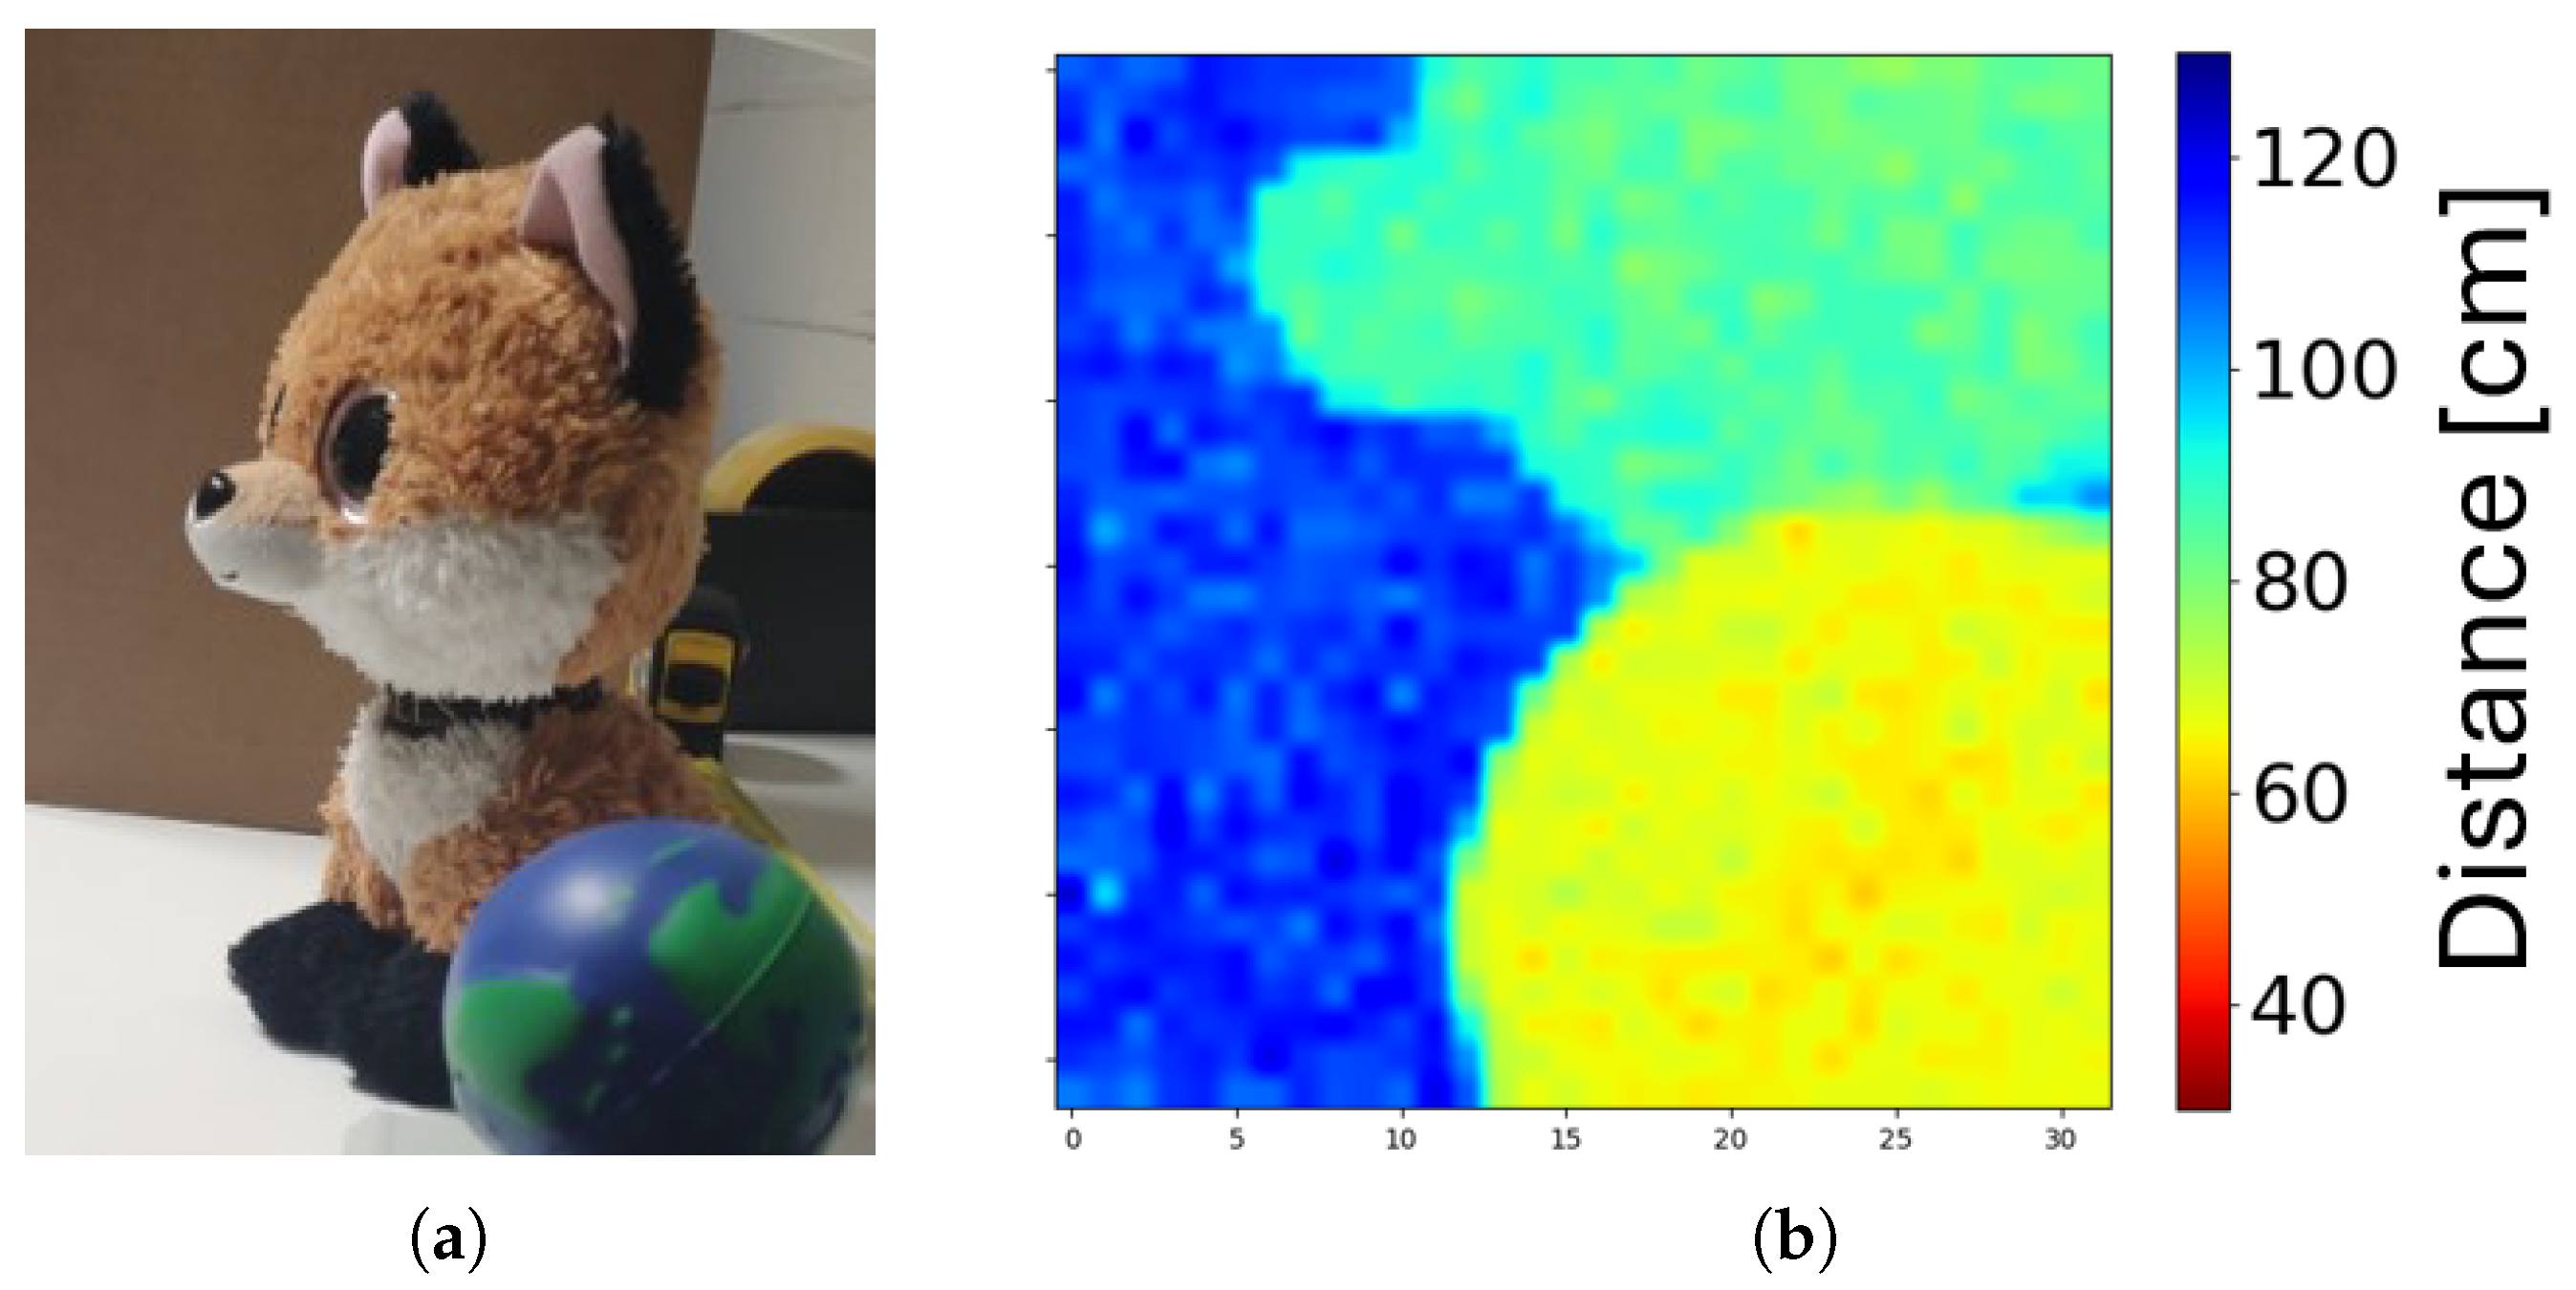
Figure 15. A snapshot of a scene with the 32×32 pixel array at the room’s ambient light. (a) Colored image of the scene. (b) The 3D image.
Full text: https://www.mdpi.com/1424-8220/24/16/5380

No comments:
Post a Comment
All comments are moderated to avoid spam and personal attacks.